
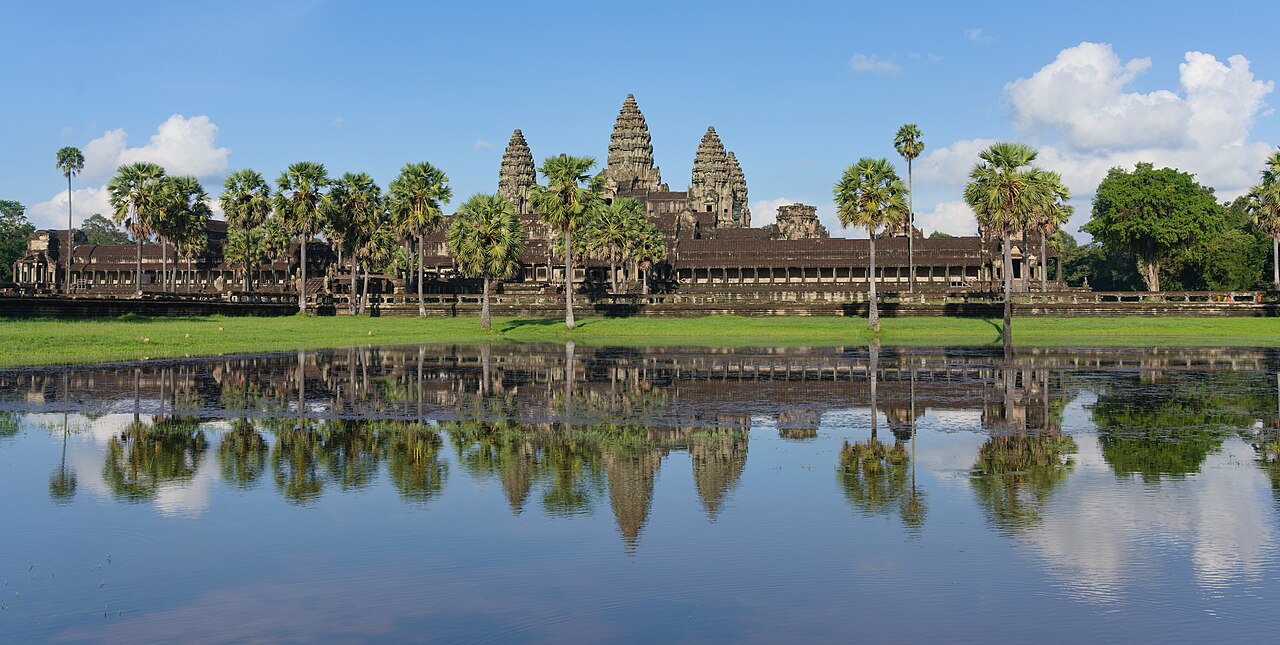

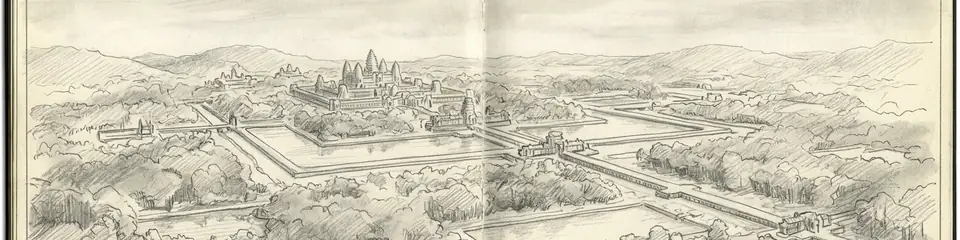
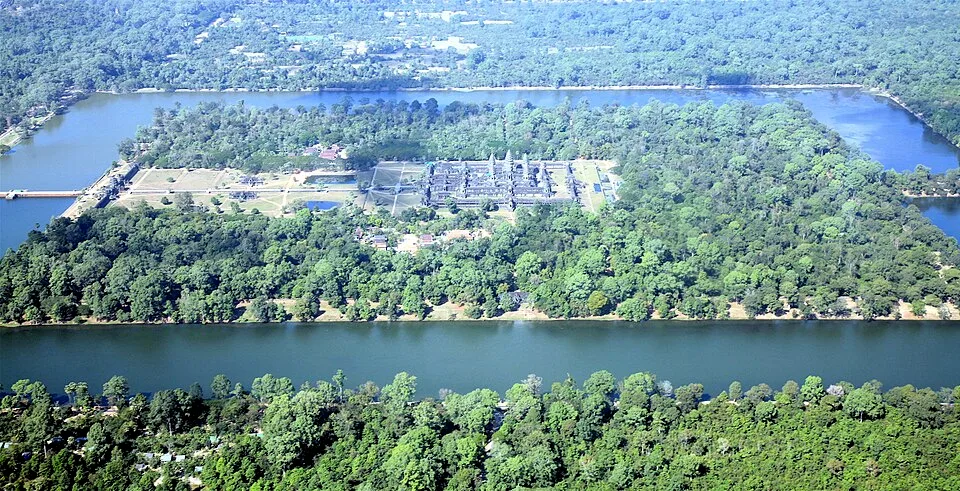
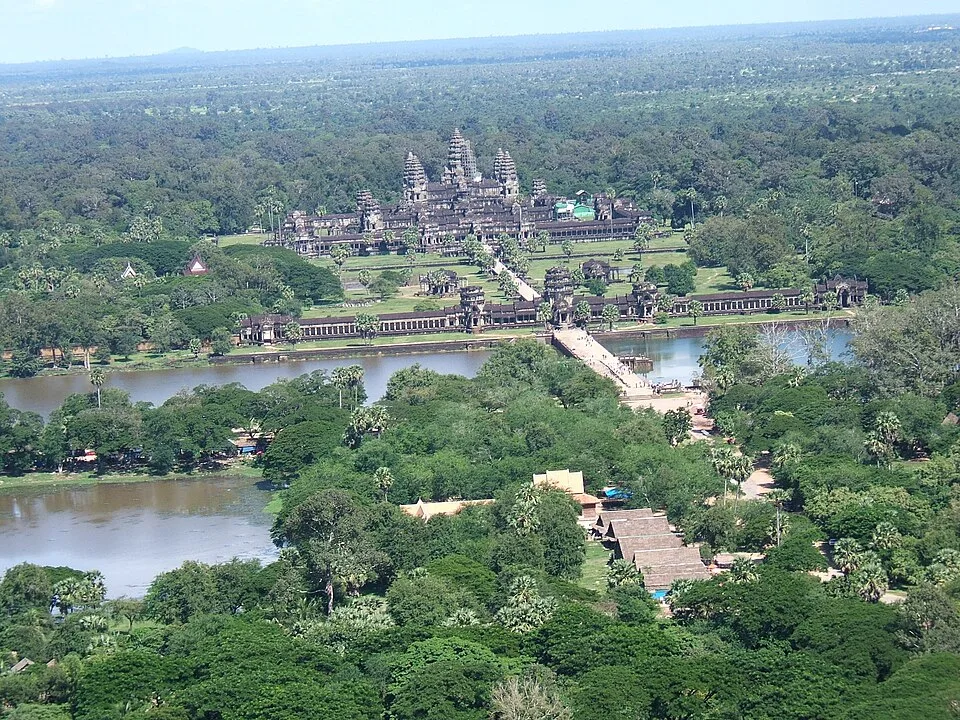
Angkor Wat — the temple complex at 13°24'N, 103°52'E in Siem Reap Province, Cambodia — is the largest religious monument ever constructed. Its outer enclosure measures 1,500 by 1,300 metres; the galleries, towers, and moat cover 162.6 hectares. It was built between approximately 1113 and 1150 CE under Khmer Emperor Suryavarman II, dedicated to Vishnu, and is still the largest single religious structure in the world by land area. It is not, however, what this story is about.
This story is about the city that surrounded it — and the other cities, roads, reservoirs, and settlements across 1,000 square kilometres of Cambodian jungle that nobody suspected were there until a sensor mounted to a helicopter found them in 2012.
"Under the canopy lay not jungle wilderness but a hydraulic city — canals, temples, and rice fields mapped in laser light."
— Paraphrase of Damian Evans et al. on Angkor LiDAR surveys (2010s)
What LiDAR Does

Light Detection and Ranging (LiDAR) works by firing rapid pulses of laser light downward from an aircraft and measuring how long each pulse takes to return. Where the ground is open, the pulse hits earth and bounces back. Where there is forest, some pulses hit leaves and branches first; but many penetrate through gaps in the canopy and reach the ground. By combining millions of returns and filtering out the vegetation signals, the instrument produces a digital elevation model of the bare earth beneath the trees.
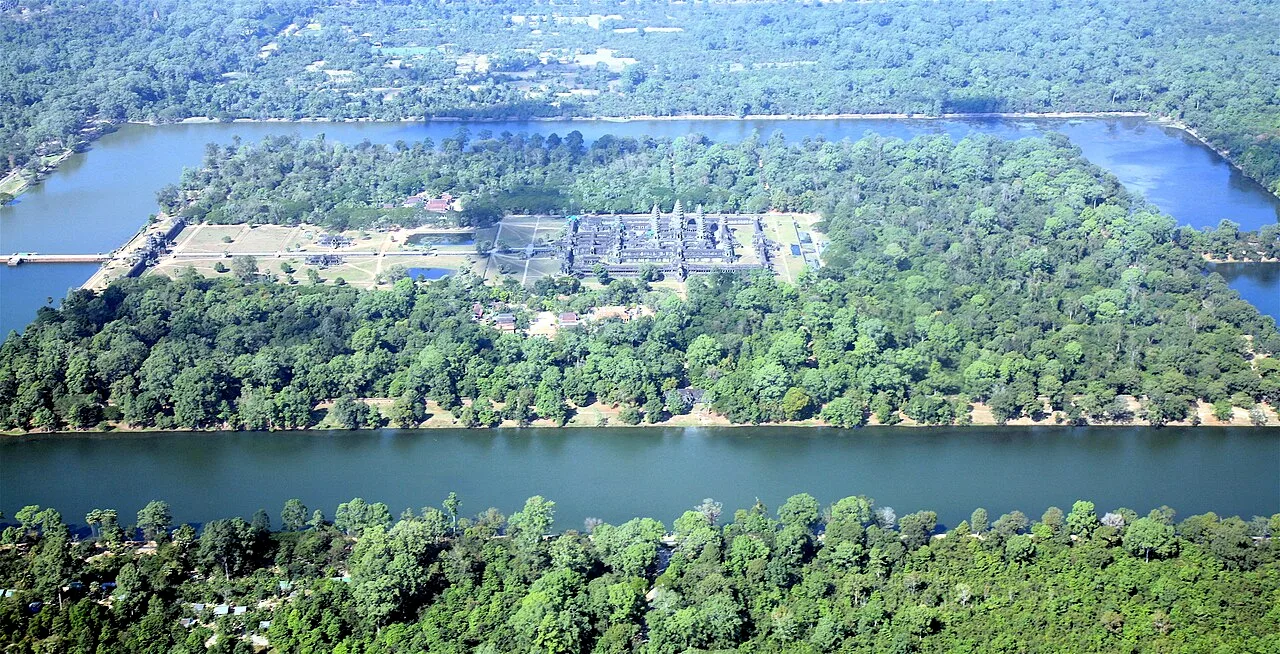
This matters for archaeology because low-relief features — the remains of buried walls, raised roadbeds, canal banks, drained pond edges — that are invisible from the ground and completely hidden by dense tropical canopy are legible in high-resolution LiDAR data. A canal bank 50 centimetres high and 800 years old, overgrown by jungle and indistinguishable on foot from the surrounding terrain, shows up in LiDAR as a clear linear feature. A buried building platform 40 centimetres above the surrounding ground level appears as a slight raised area with right-angled edges.
The 2012 and 2015 Surveys
The Cambodian Archaeological Lidar Initiative (CALI), led by archaeologist Damian Evans of the French School of the Far East (EFEO), flew two surveys: 370 square kilometres in 2012, 1,901 square kilometres in 2015. The results were published in the Proceedings of the National Academy of Sciences in 2016.
The data showed a dispersed low-density urban complex centred on Angkor and extending for approximately 1,000 square kilometres in every direction. The complex included:
A rectilinear road network connecting the major temples and settlements, with raised road beds crossing wet-season flood areas via embankments. Side roads branching off into residential areas. Small rectangular mounds at regular intervals throughout the residential zones — the bases of wooden houses, now gone, that had stood on raised platforms. Canals, channels, and embankments forming a water management grid across the entire landscape. Reservoirs (barays) connected to the channel network. A spiral of settlement extending continuously from Angkor Wat and Angkor Thom (the walled royal city 1.5 kilometres north) through suburbs, through outlying temple complexes, through agricultural areas, to satellite towns 30–40 kilometres away.
No single previous map, survey, or ground-based study had captured this. Previous estimates of Angkor's population had ranged from 100,000 to 200,000. The LiDAR data supported a revised estimate of 750,000 to 900,000 at peak — making Greater Angkor the largest preindustrial urban complex in the world by area, larger than the next nearest candidate (the lowland Maya cities of the Yucatan Peninsula, whose own LiDAR data also emerged in the 2010s and similarly expanded earlier estimates).
The Water That Built the Empire
The most important discovery in the LiDAR data was not the extent of the urban footprint but the nature of the hydraulic infrastructure underlying it.
Khmer engineers had built an interconnected water management system of extraordinary complexity. The city occupied a flat alluvial plain with seasonal flooding: the monsoon brings 1,500–2,000 millimetres of rain between May and October; the dry season brings almost nothing. To sustain rice cultivation across a dispersed urban landscape year-round, the hydraulic system captured monsoon runoff in large reservoirs (the biggest, the West Baray, measures 8 by 2.1 kilometres and still holds water), distributed it through channels to paddy fields during the dry season, and managed drainage to prevent catastrophic flooding during the wet season.
The LiDAR data showed that this system was far more intricate than previously mapped. Channels extended for hundreds of kilometres. Embankments had been built and rebuilt multiple times, indicating continuous engineering over at least three centuries. The infrastructure was the structural prerequisite for the population density that the settlement data suggested.
Why the City Fell
The same LiDAR data that revealed the scale of Angkor also revealed the mechanism of its collapse — and it was not conquest, as had sometimes been assumed.
The hydraulic infrastructure shows clear evidence of repair attempts that failed. In the 14th and 15th centuries, sand plugs were inserted into channels, apparently to reroute water; they did not hold. Embankments were breached and not repaired. The repair sequences visible in the stratigraphy of the canal fills suggest increasingly desperate engineering responses to a deteriorating system.
Tree-ring records from Vietnam and Thailand, and sediment cores from the Mekong Delta, document prolonged drought periods in the early 15th century, interrupted by intense monsoon seasons — a pattern consistent with the ENSO variability that characterises the region's climate. The hydraulic system, highly tuned to a specific rainfall regime, failed under conditions it was not engineered for. Population dispersal followed gradually; the capital was formally moved to Phnom Penh in 1432, but Angkor was not abandoned — it remained inhabited and maintained at a reduced scale for another century.
The diplomat Zhou Daguan, who visited Angkor in 1296–1297 CE on a Chinese mission, wrote a detailed description of the city while it was functioning at near-peak capacity. He described crowded markets, a royal procession of hundreds of elephants, administrative districts, and a population living in palm-thatched houses on raised platforms — exactly the kind of settlement the LiDAR mounds represent. His account remained the most detailed external description of Angkor until the French explorers arrived in the 19th century. It is now possible to read his text against the LiDAR map and identify specific districts he describes.


